Following a discussion on Twitter with the fellow analysts @gnepon and @cchappas on distributions of player metrics, we thought we can add insight by publishing the distributions of Goalimpact values in our DB.
Before presenting the result some words of cautions. The distribution is the distribution of all players in our database. It is not the distribution of all players on the world. The top 10% of all players in the database are probably top 0.000001% of all players on the world (made-up number. You get the point).
The shape of the distribution on the left-hand side is given by the number of lower leagues in the database. As there are unlikely to be better players on this planet than those in the database, the right-hand side should be reflecting the tail of the true distribution of player performance.
Basis for this analysis are all 49,285 players in our database that were registered as active as on the 1st of February 2014. There are no restrictions on league level or geography. Just everything.
OK. Enough disclaimer. Here is the beef.
![]()
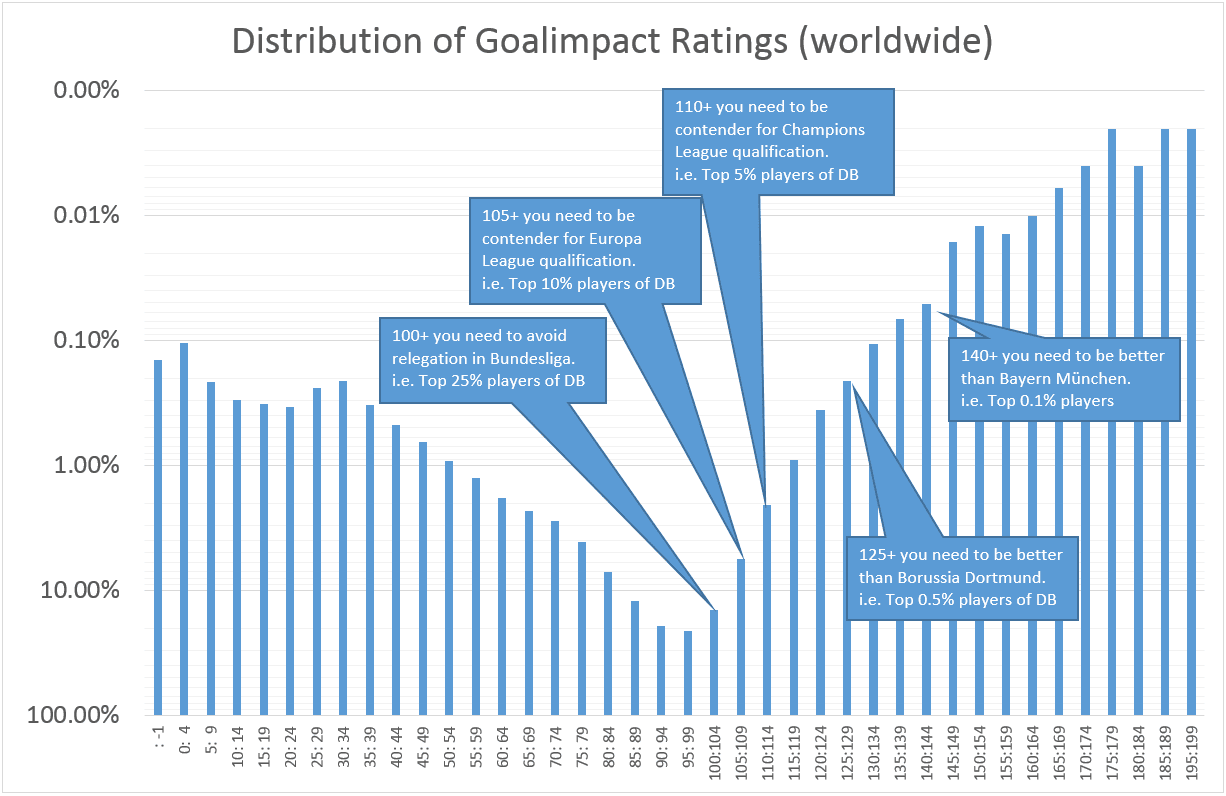
How to read that? The x-axis defines intervals of Goalimpact values and the y-axis denotes the percentage of players in that range. 21.3% of all players have a Goalimpact between 95 and 99. This is the interval with most players inside followed by 90 to 94.
If you are a team manager of a Bundesliga club, you most likely will want to avoid relegation. If this is your only aim, you should seek to staff your team with players that are among the best 25% of all players in the database, i.e. with player that have a Goalimpact of 100 or higher. If you are more ambitious and you'd like to qualify for the Europa League, you already need to search among the top 10% of all players and set your cut-off at a Goalimpact of 105. But for Champions League qualification even this is not good enough. you will need to look out for top 5% players, 110 or better.
The point is that the number of players available that are good enough for your objective shrinks very fast with the league target rank you aim for. If you want to be better than Borussia Dortmund, only top 0.5% players are good enough. Go and try to find player that are better than 125. This is what Bayern Munich should aim for if wining the German championship is their prime target. Apparently, they have bigger aims than that, because they are stuffed with 0.1% players. So that is what you need to contend for the Champions League title. So it is no surprise that the prices for the best players go ballistic. It is a very inelastic supply curve. Only 61 players have 140 or more. They carry all the profit you can with a Champions League profit in them.
For the math literate among you that know how to read a log-scale histogram, here is the same chart again. If you can't read it. Doesn't matter. It is basically the nerdy version of the chart above.
![]()
Before presenting the result some words of cautions. The distribution is the distribution of all players in our database. It is not the distribution of all players on the world. The top 10% of all players in the database are probably top 0.000001% of all players on the world (made-up number. You get the point).
The shape of the distribution on the left-hand side is given by the number of lower leagues in the database. As there are unlikely to be better players on this planet than those in the database, the right-hand side should be reflecting the tail of the true distribution of player performance.
Basis for this analysis are all 49,285 players in our database that were registered as active as on the 1st of February 2014. There are no restrictions on league level or geography. Just everything.
OK. Enough disclaimer. Here is the beef.

How to read that? The x-axis defines intervals of Goalimpact values and the y-axis denotes the percentage of players in that range. 21.3% of all players have a Goalimpact between 95 and 99. This is the interval with most players inside followed by 90 to 94.
If you are a team manager of a Bundesliga club, you most likely will want to avoid relegation. If this is your only aim, you should seek to staff your team with players that are among the best 25% of all players in the database, i.e. with player that have a Goalimpact of 100 or higher. If you are more ambitious and you'd like to qualify for the Europa League, you already need to search among the top 10% of all players and set your cut-off at a Goalimpact of 105. But for Champions League qualification even this is not good enough. you will need to look out for top 5% players, 110 or better.
The point is that the number of players available that are good enough for your objective shrinks very fast with the league target rank you aim for. If you want to be better than Borussia Dortmund, only top 0.5% players are good enough. Go and try to find player that are better than 125. This is what Bayern Munich should aim for if wining the German championship is their prime target. Apparently, they have bigger aims than that, because they are stuffed with 0.1% players. So that is what you need to contend for the Champions League title. So it is no surprise that the prices for the best players go ballistic. It is a very inelastic supply curve. Only 61 players have 140 or more. They carry all the profit you can with a Champions League profit in them.
For the math literate among you that know how to read a log-scale histogram, here is the same chart again. If you can't read it. Doesn't matter. It is basically the nerdy version of the chart above.