Edgar Davids was a great football player. Maybe one of the greatest player of his time. But he was also a passionate
chess player and he improved his chess game lately. Besides that, he is also great research case for football analytics, because he actually still is an active player. He currently plays for Barnet FC in the fifth English league. Obviously, his playing skills are much lower today than they were at his peak time, but how good is he now? Is he still a better football player than chess player?
If we try to answer that question, we should answer a more basic question first: What is actually a good player? How do we measure that, so we can compare the same player at different ages? (I'll explain
my approach in the next two sections. You my want to skip that if you are already familiar with it)
Bottom-up player models
One way to score players is to collect large amounts of data describing their play. How many tackles did they do? How many goals did they score? How many assists? Passes? Long Passes? Distance covered? Key passes? Than we need to relate the numbers to each others and come up with a score. In other words, we need a model of football. We need to know if/when a high pass percentage is better. Is it a proxy for good passing skills or lack of risky passes? Is many tackles a good thing or a sign of bad positioning? Is a striker scoring many goals because of his superior shooting ability or is he just the lone striker in a team that focuses on fast-breaks and thus get all the high-quality chances that anyone would convert?
Imaging we would use this approach in the chess world. We would collect data on the games of a player. What is the pawn move percentage? How many opponents pieces does he take per move? What is the average number of moves per game? What is his average number of moves before the first queen move? After that, we will try to relate the numbers and come up with a score. Chess, despite all complexity, is a much simpler game than football. So it is much easier to come up with reasonable statistics and a bottom-up model of chess to rate players. Yet nobody does this. In fact, everybody would find it a very silly idea. Why? Why did we never read long articles in the newspapers discussing the average rate of pawn moves of Carlsen and if this makes him better or worse than Anand? The answer is simple: because it is much more efficient to judge chess players from the result.
Top-down as we call it.
Top-down player models
In chess, the gold standard is an algorithm called Elo. It rates players game by game given their game results and the strength of the respective opponent. The algorithm was so successful that it is basically the only stat you will ever read on a chess player. Even the world ranking list is based on it. So, unlike the
FIFA ranking in football, the
chess world ranking list actually sorts the players purely by their playing ability.
So why don't we just use Elo for football, too? Well, actually some analyst did just this. E.g.
ClubElo uses a modified version to rate football teams. The
Euro Club Index does the same with a variant of it. But due to the fact that football is a game of eleven vs. eleven players, it is difficult to apply Elo on individual players (as opposed to teams). Elo will not be able to attribute the contributions to the players involved in an optimal fashion.
Goalimpact tries to solve this problem and create a top-down metric for football players. It measures the correlation of a player being on the pitch with the outcome of the game as measured by the goal difference. If a
team consistently scores more goals and concedes less with a certain player than without him, that player receives a high score value. The trouble with achieving this is that you need data. A lot of data. A hell of a lot of data. Simply because the subject of investigation is a very rare event, we need a lot of observations. There is no way around. As we can't get the players to play more often, we need to go back in time and collect their old games.
Averaging across time
To solve the issue of scarce data, Goalimpact uses all data available. That is, in the score of each player all of his games ever are reflected. Not a single game is dropped. This ensures we get the critical mass we need to get statistically significant results. But there is a major drawback. It implicitly assumes that the player has the same playing strength throughout his career. An assumption that doesn't hold in reality. In fact, it isn't even close to hold in reality. Teenage players tend to lack the strength and experience to compete with player in their mid twenties. Conversely,
players beyond 35 play seldom at the top level. In fact, the market values as published by transfermarkt.de show a
peak around the age of 26. Markets values rise until that age and drop thereafter.
Averaging the whole career of a player leads to a bias. Young players will be scored too low, because the average still is dominated by the weaker performances in their early games. But very old players see the opposite effect. They will be overvalued because the career average drops only a tiny little bit each game, because the new games are only a drop of extra data that hardly has any impact on the overall average. We actually can see this on Edgar Davids' Goalimpact. He currently has a score of 147. With that value he would be one of the best players, placed high up
among the world's elite - if it would be just true. Having past the age of 40, he may well be still good enough for the fifth league, but he is certainly not good enough for Premier League.
How do we get around this? We could average shorter time periods, but this will be at the expense of statistical significance. For some players we have enough observations and we may still get significant results if we split the career in two or even three buckets. E.g. we have more than 40,000 match minutes of Edgar Davids, so a split would work. But for most players we do not have that much data and we face the trade-off between time resolution and accuracy. Shall we produce a stable result that averages out the age profile of a player or are fluctuating numbers better that will trace the age profile albeit being subject to a lot of noise?
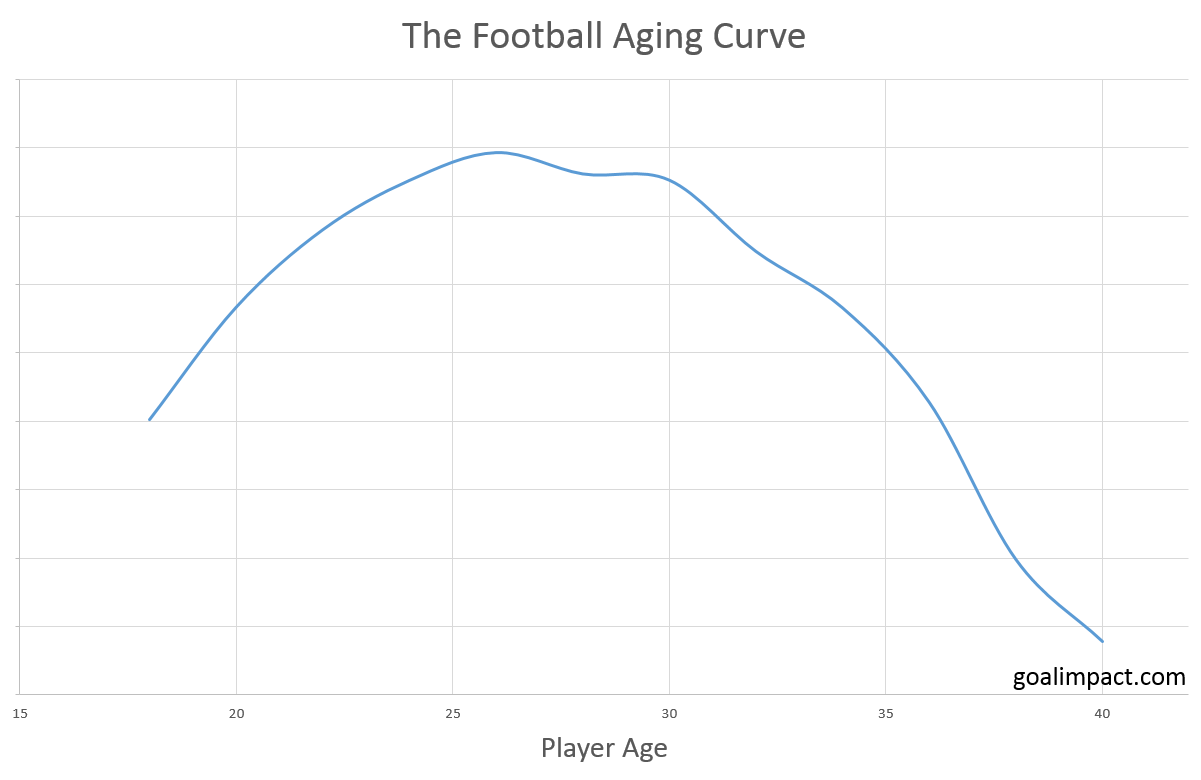
The Football Aging Curve
To circumvent the issue, we introduce as of today a new factor to Goalimpact. All the results of all matches will be set in to the perspective given the age of the players involved. This allows for cross-time averaging without introducing a bias for young and old players. The Goalimpact of young players will be lower just because they are young and so will be the score of old players. This aging curve itself is based on the average age profile of all non-goalkeepers in the database. This is such a large amount of data that allows us to come up with a precise average football aging curve. The individual ups and downs of players will be still averaged out. However, the systematic effect of age is compensated for.
![]() |
The football aging curve increases until an age of approximately 26 and
drops thereafter. But the differences between the age of 25 until 30
are minor. After 30 the slope becomes considerably negative. |
Using that curve to correct the players' Goalimpact values, allows us to continue to use all the data available and get statistically significant results. At the same time, it allows us to estimate the
current playing power of a player instead of reporting a career average only. For example, Edgar Davids' current Goalimpact is -31 (yes, minus thirty-one). Quite a bit lower than his career average of 147.
Having a good estimate of Edgar Davids' current football skills, in order to find out if he is still a better football player than chess player, all we need to find out is his chess Elo. We leave that task to the chess analysts though. But for the the football analyst, we hope he continues to play many years. We would then maybe eventually be able to extend the aging curve of football until the age of 50.